Century 21 People’s Choice Realty Inc., Brokerage
120 MATHESON BLVD E #103
MISSISSAUGA, Ontario
L4Z 1X1


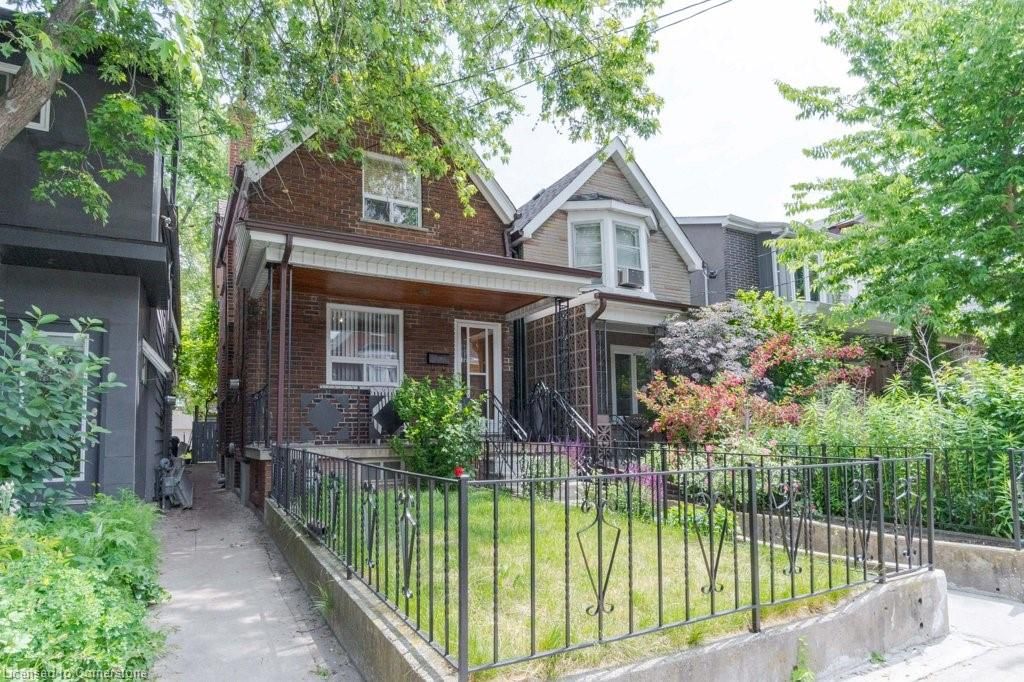
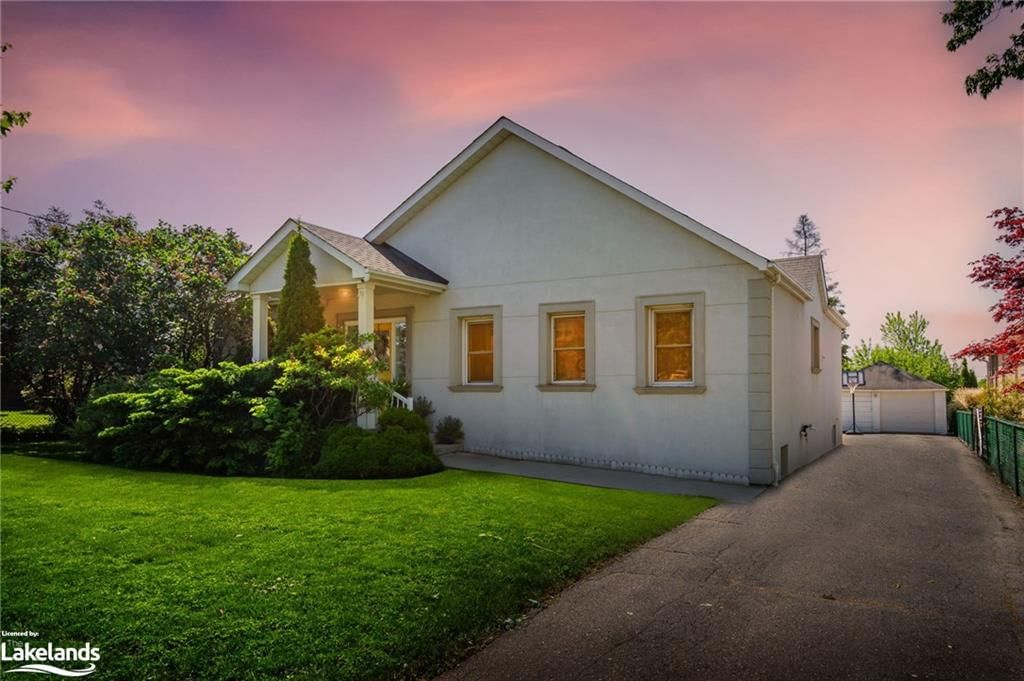
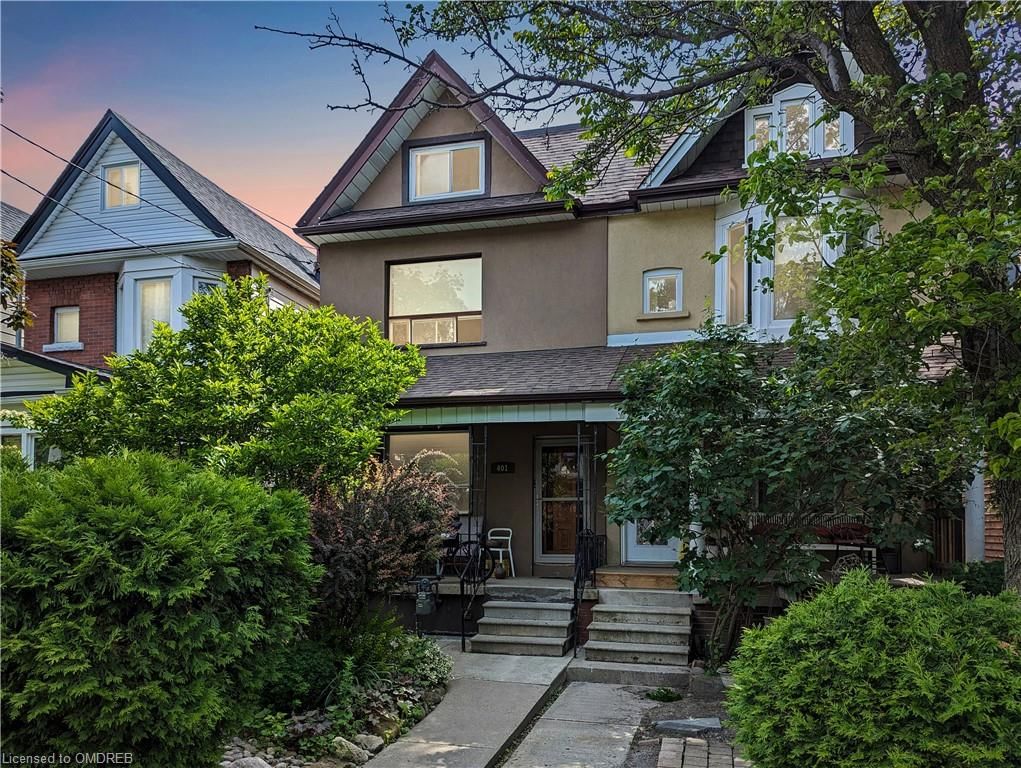
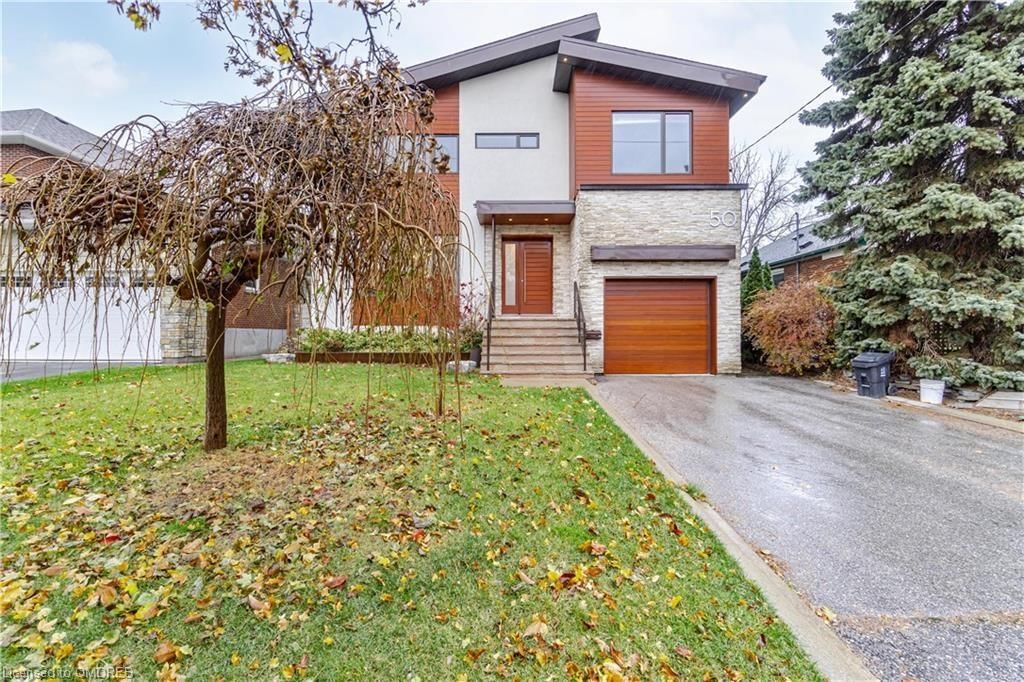
Toronto, Wychwood, M6G 2C2
$999,900$000000
Listed by Berkshire Hathaway HomeServices West Realty.
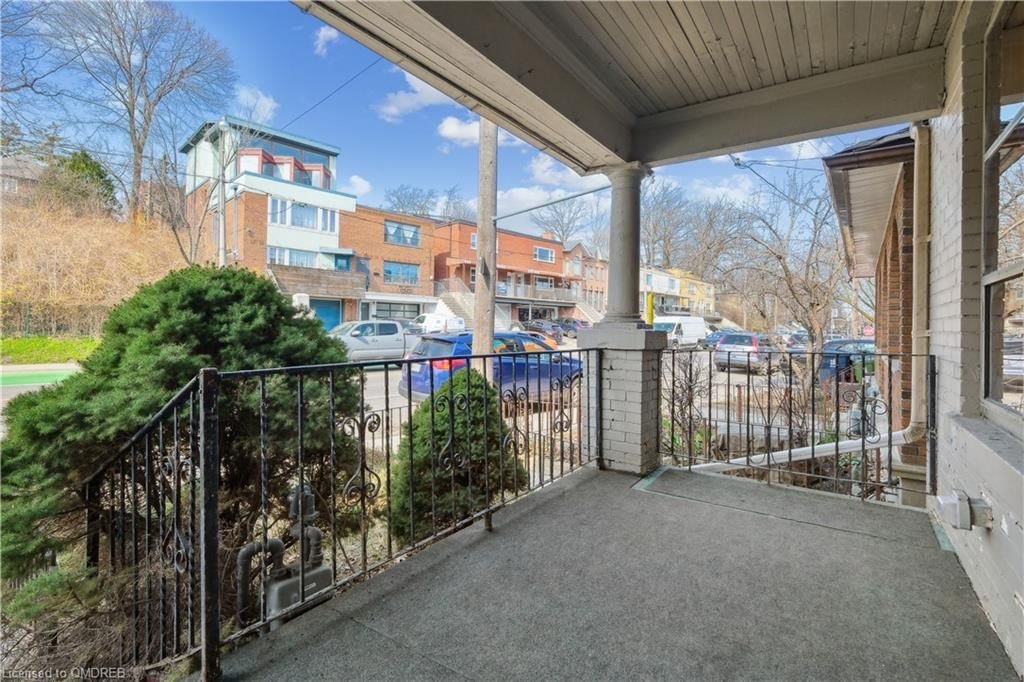
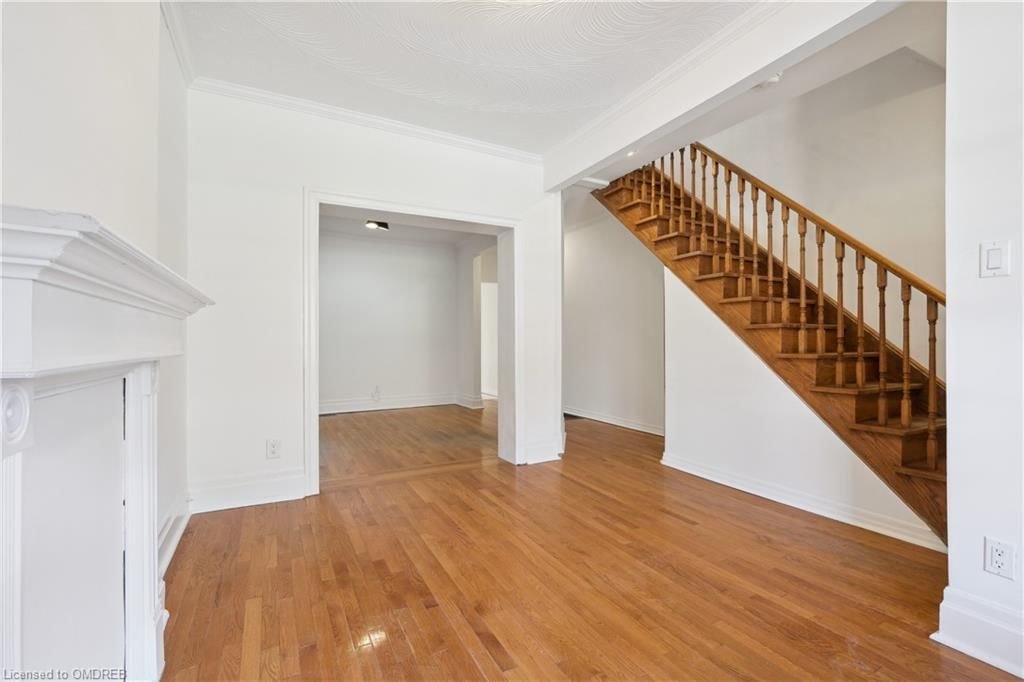
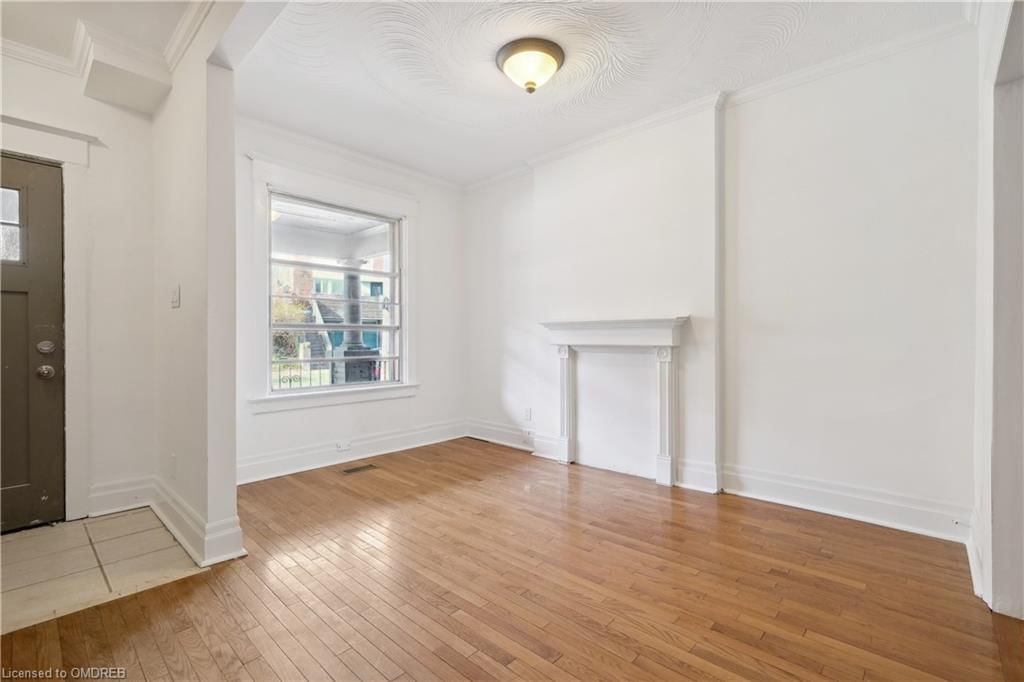
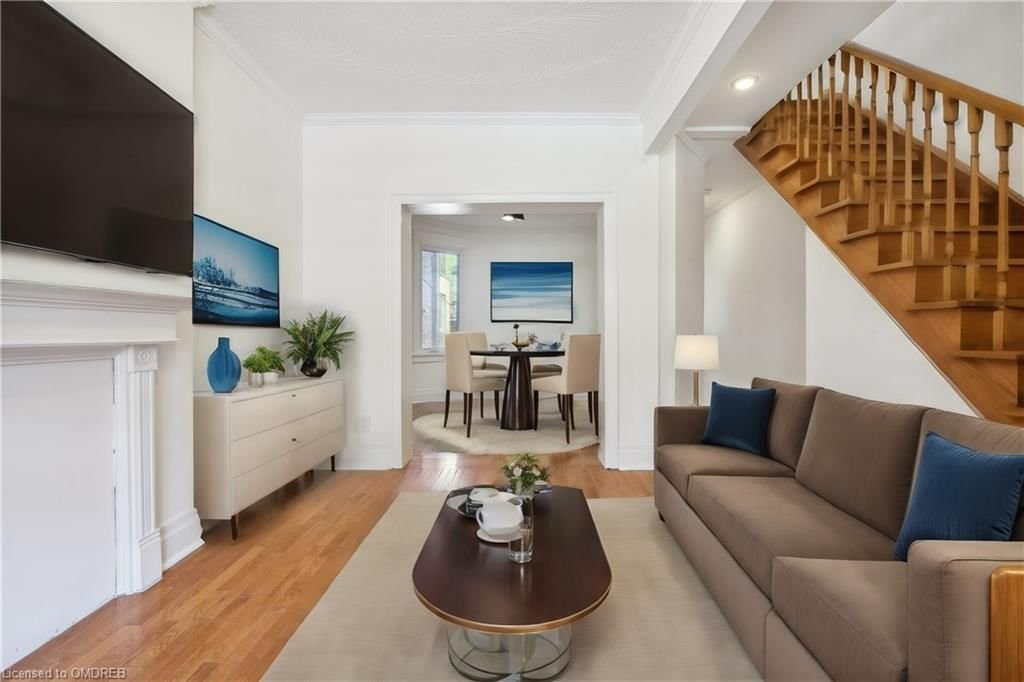
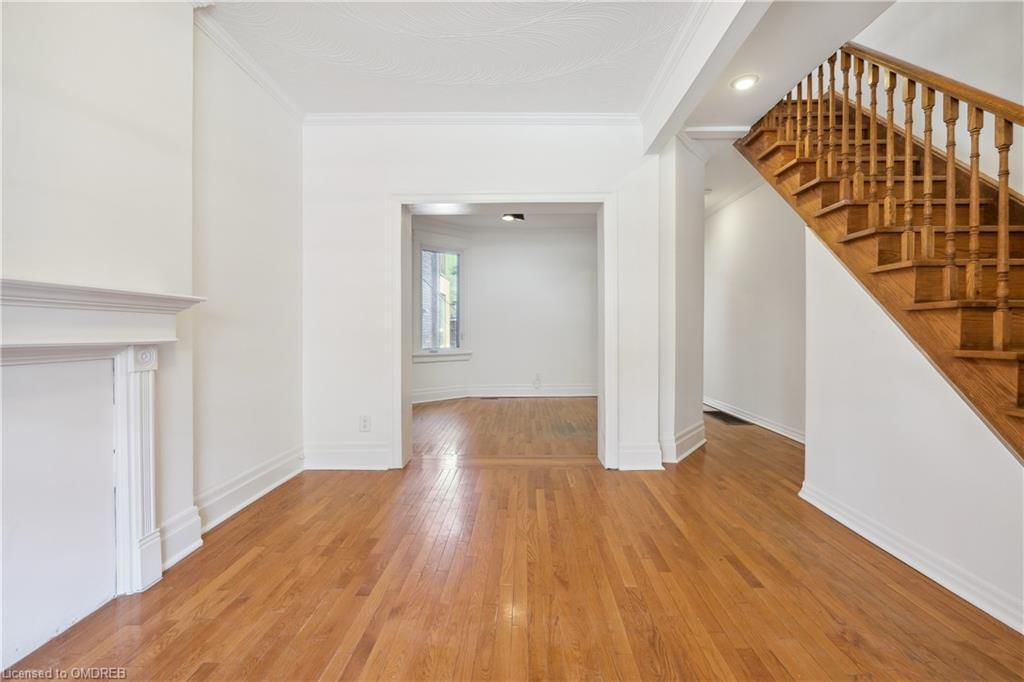
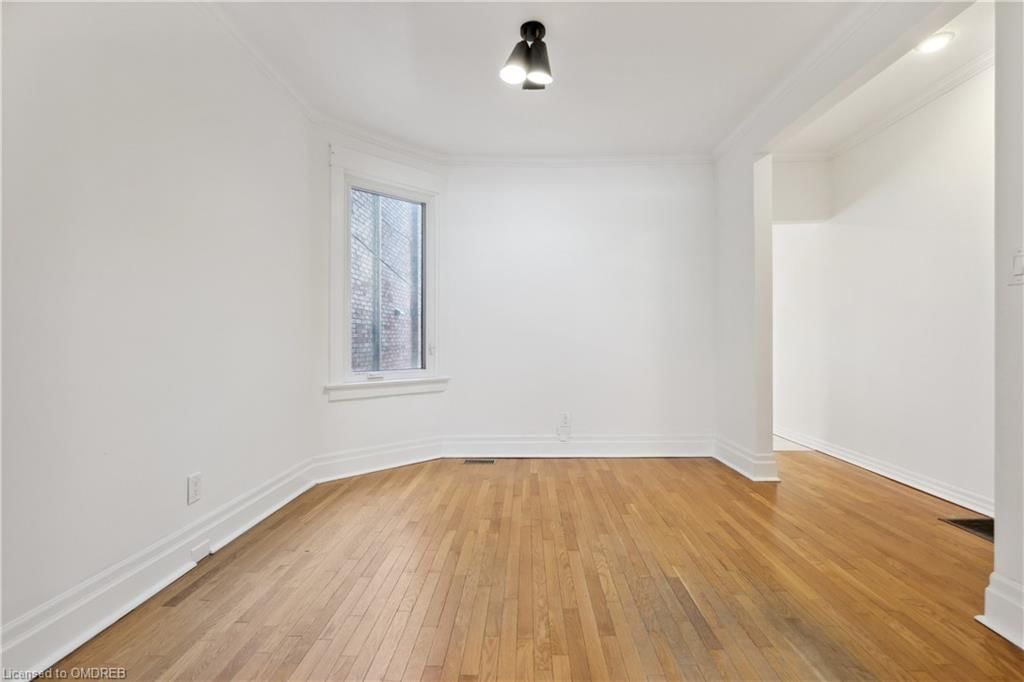
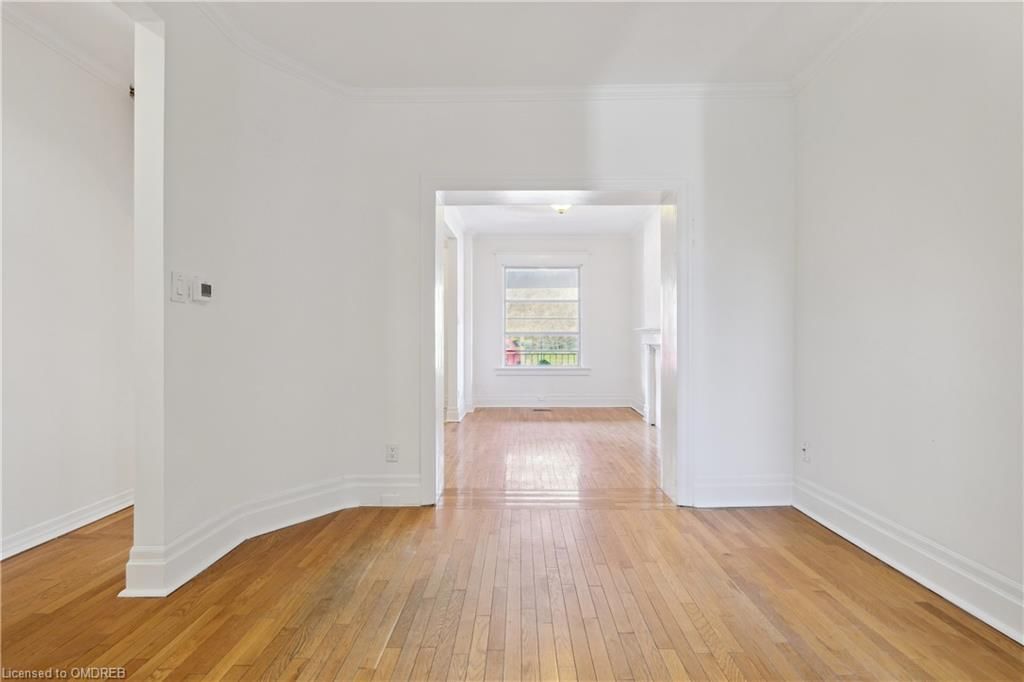
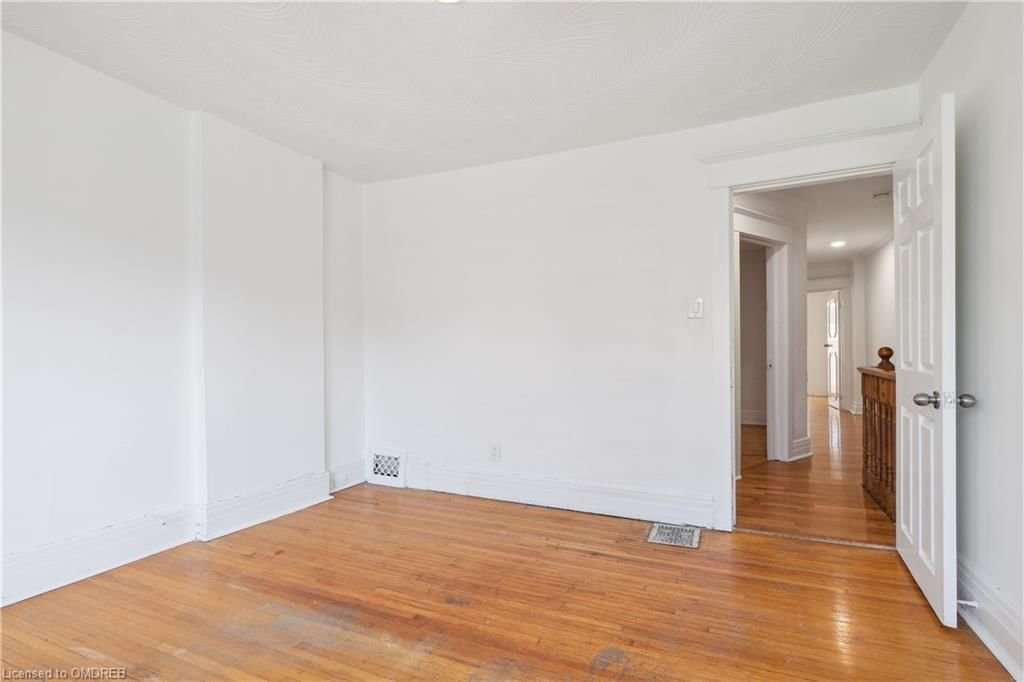
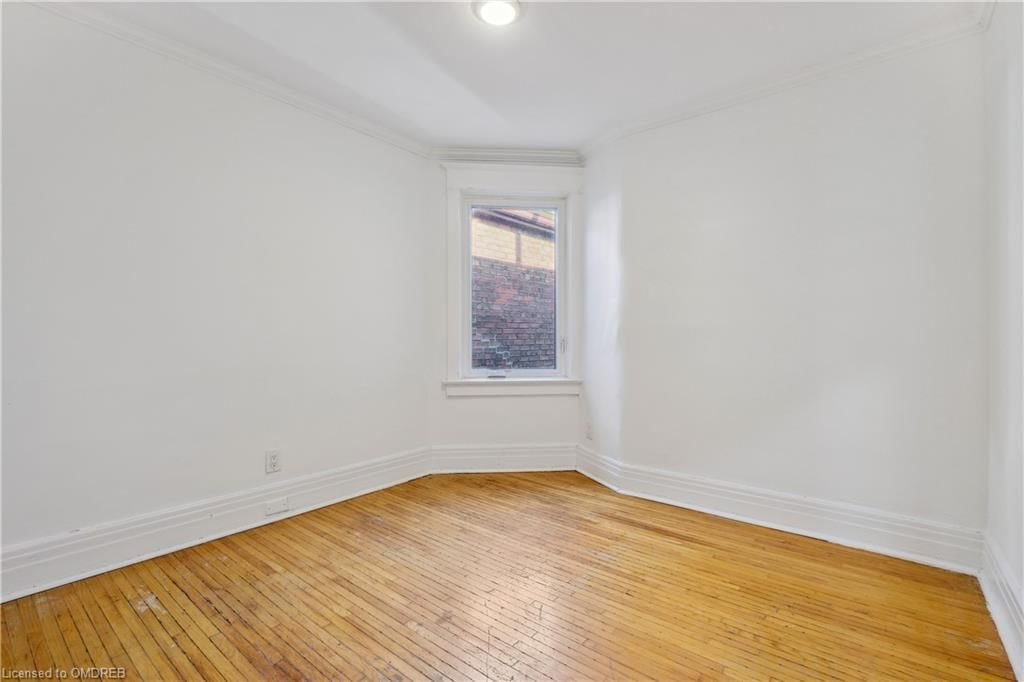
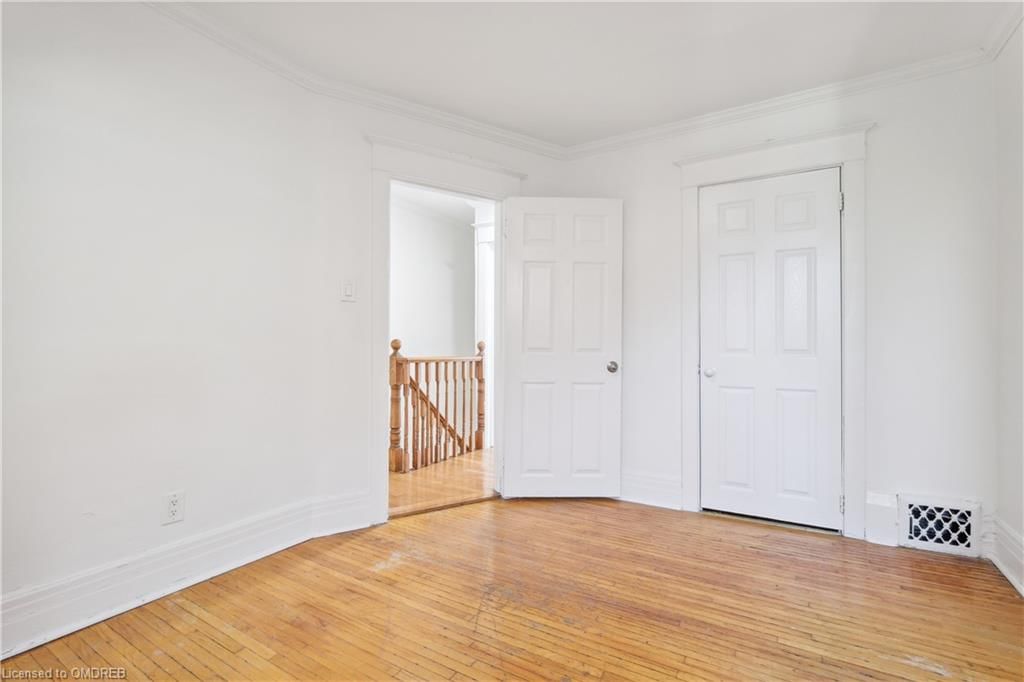
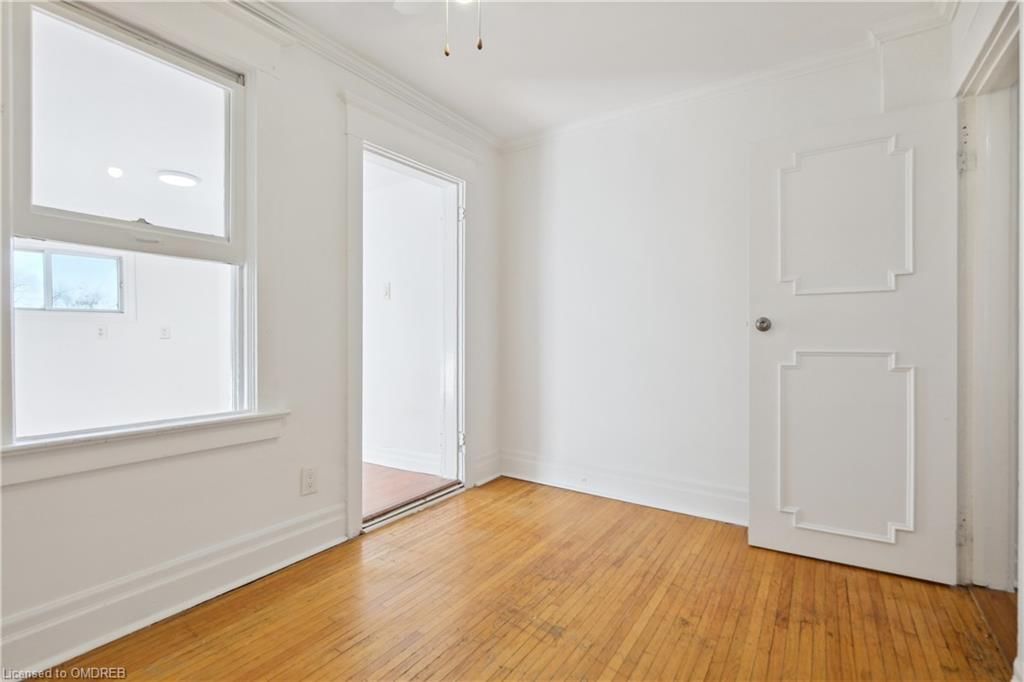
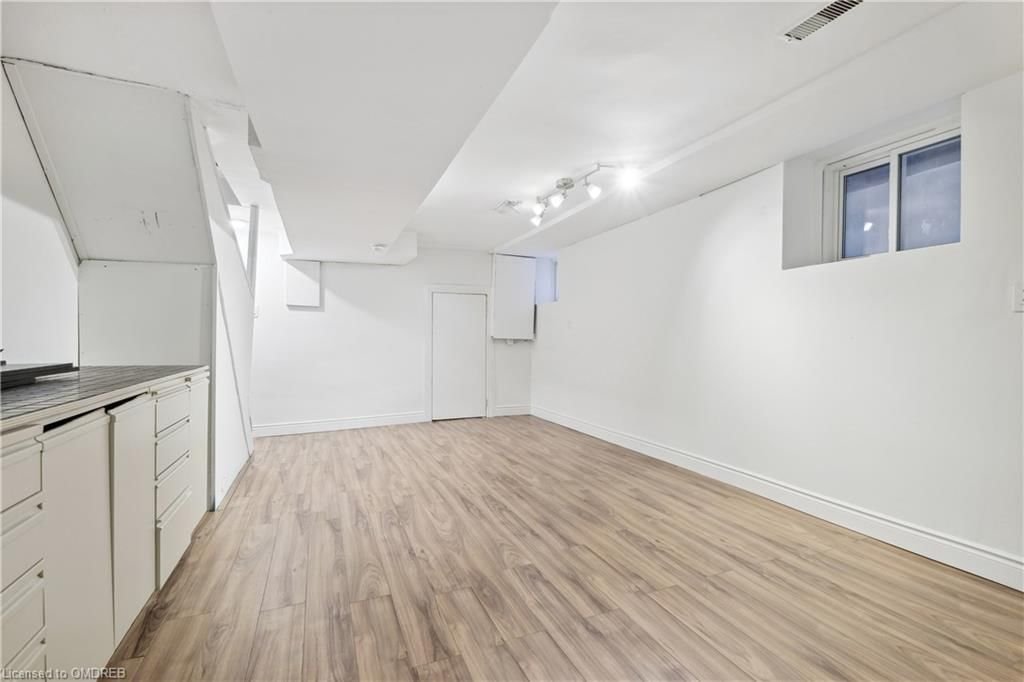
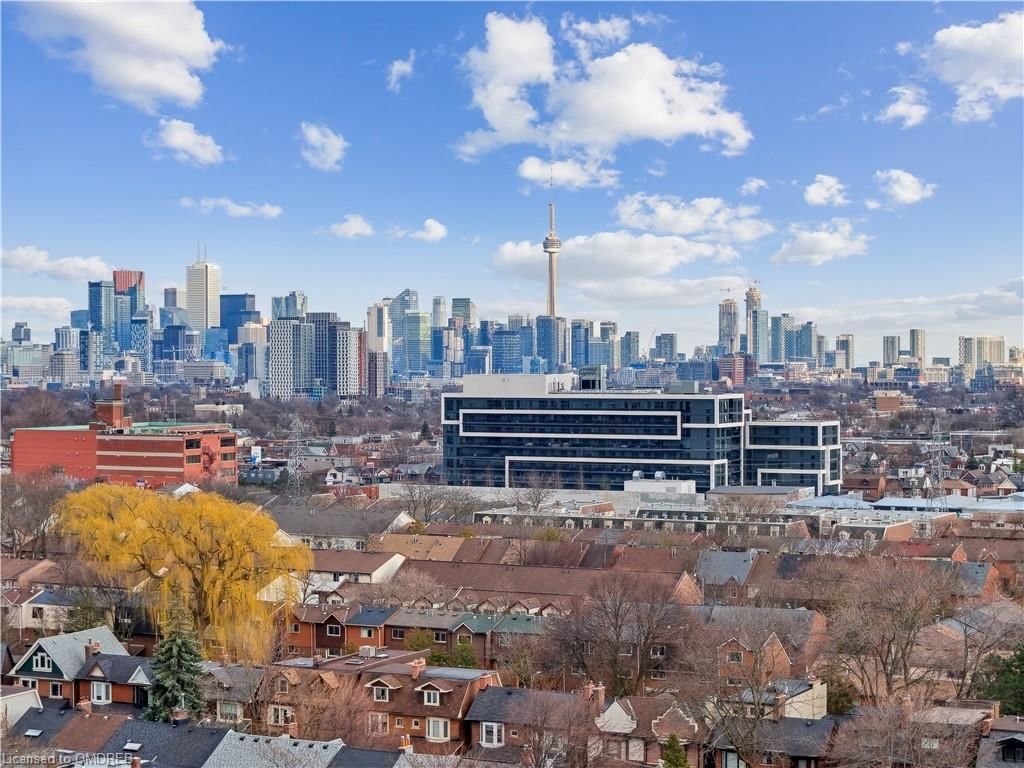
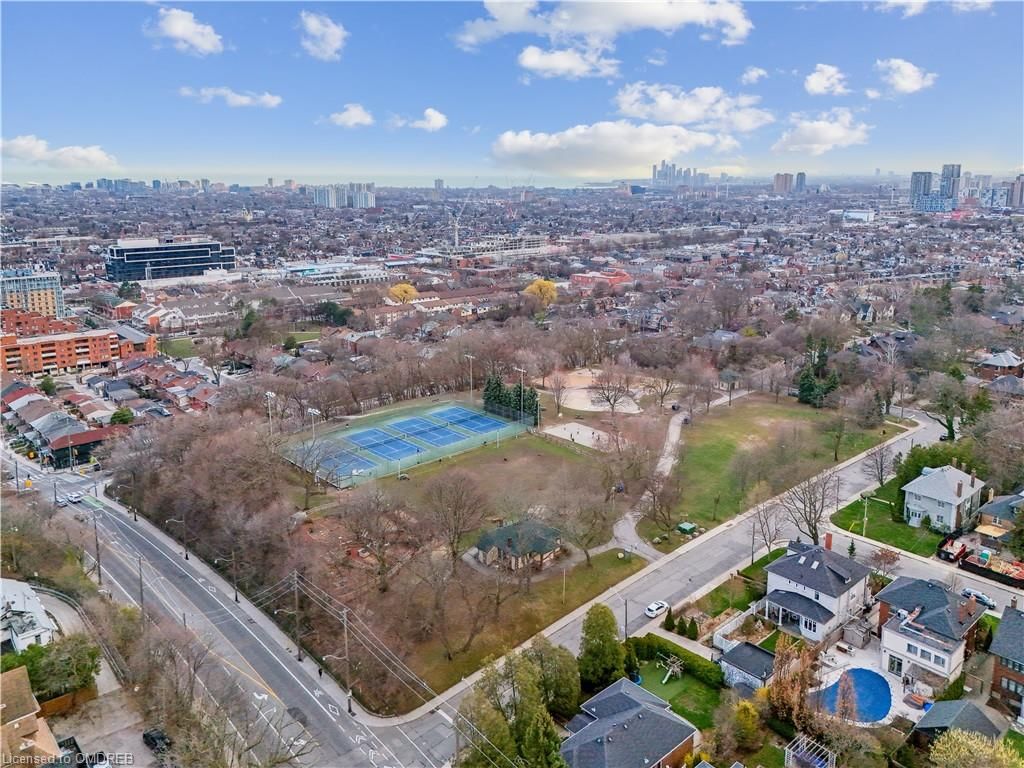
This Is The One! A Traditional 4+1 Bedroom Home Perfectly Situated In Between The Citys Most Sought-After Neighbourhoods: The Annex, Casa Loma, Yorkville And Summerhill. Featuring Over 1,700 SqFt Of Total Living Space, This Charming Wychwood Classic Is The Upgrade Youve Been Looking For. The Finished Basement Features Its Own Separate Entrance To A Basement Unit With Additional Kitchen, Washroom & Storage Space. Possibilities Are Truly Endless With This Versatile Semi; Single Family Home, Rent As A Duplex Or Convert Into An Income Producing Triplex. Welcome To Your Most Connected Lifestyle At A Premiere Address. 5 TTC Bus Routes At Your Door & Steps From Dupont TTC Subway Station (12 Min To Union Station). 96 Transit Score, 92 Walk Score, 90 Bike Score. Minutes From Top Institutions: UofT, George Brown, Upper Canada College & The Royal Conservatory. Walk To The Citys Best Parks, Restaurants, Cafes And Shops. Decide Between Gourmet Groceries At Summerhill Market Or Homemade Dishes at Rapido! Surrounded By Taste-Making Amenities, Culture & Sophistication In One Of Torontos Most Dynamic Neighborhoods. Some photos have been virtually staged.
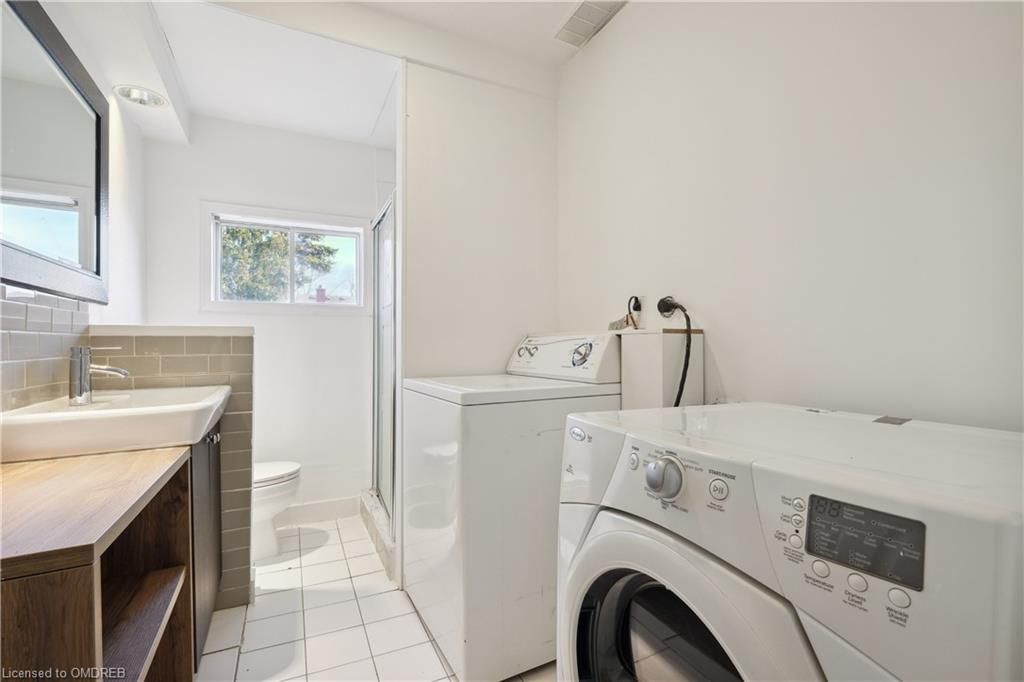
Other,Roof (2018), All Existing Appliances On Main Floor: Fridge, S/S Stove, S/S Hood Fan. Washer & Dryer. All Existing Appliances In Basement: Oven, Hood Fan, Fridge. Any Existing Light Fixtures. All Inclusions Are In As-Is Condition.
Copyright 2025 Information Technology Systems Ontario, Inc. The information provided herein must only be used by consumers that have a bona fide interest in the purchase, sale, or lease of real estate and may not be used for any commercial purpose or any other purpose.
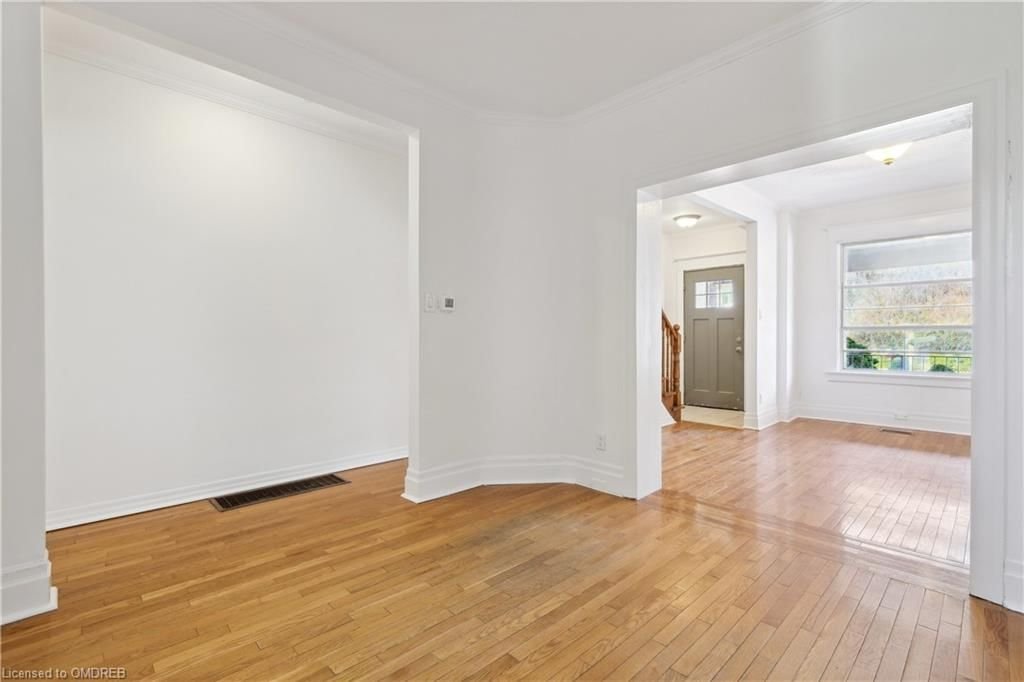
Dining Room
Living Room
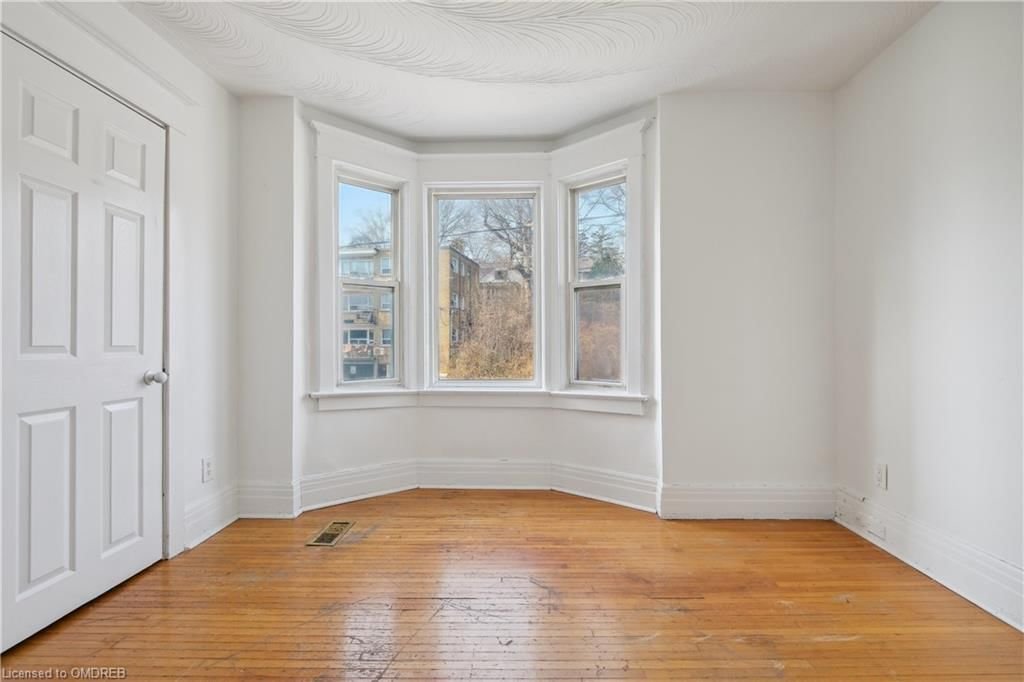
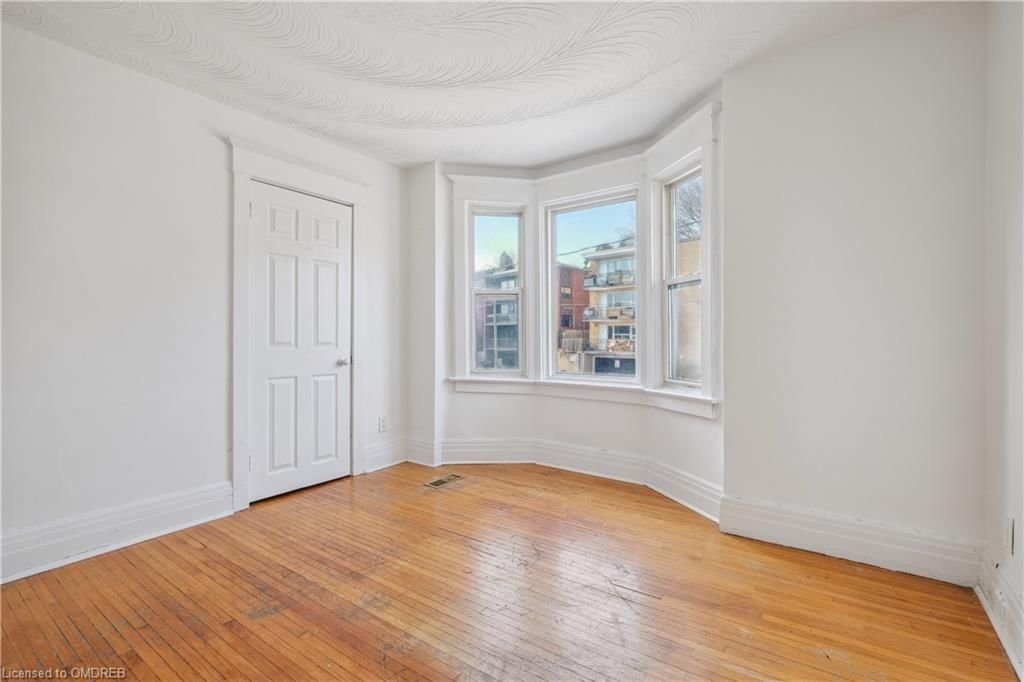
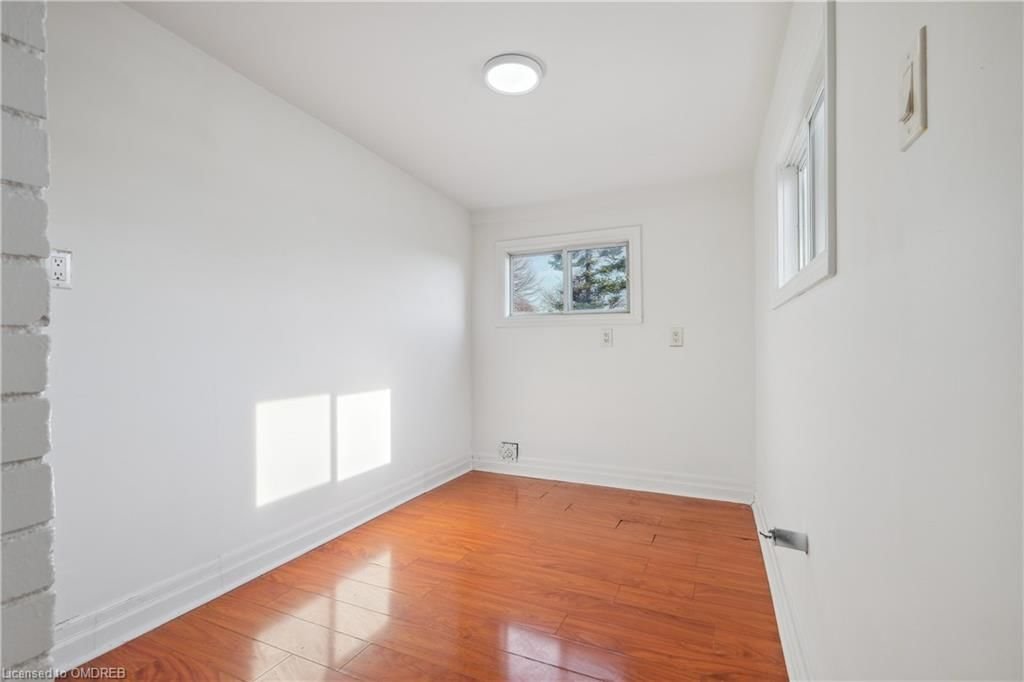
Bedroom
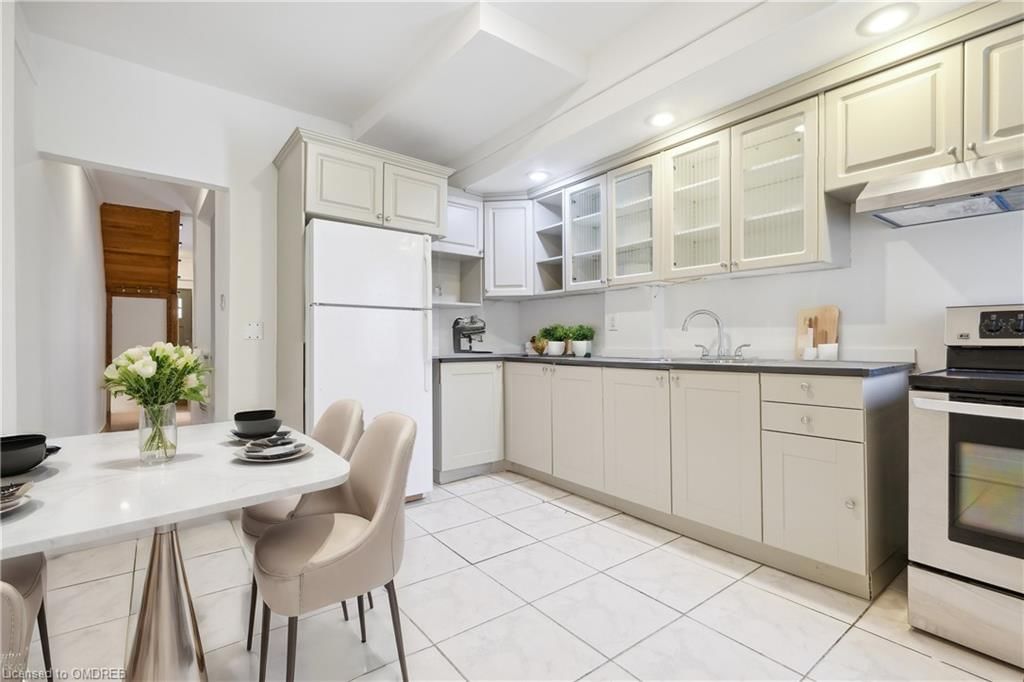
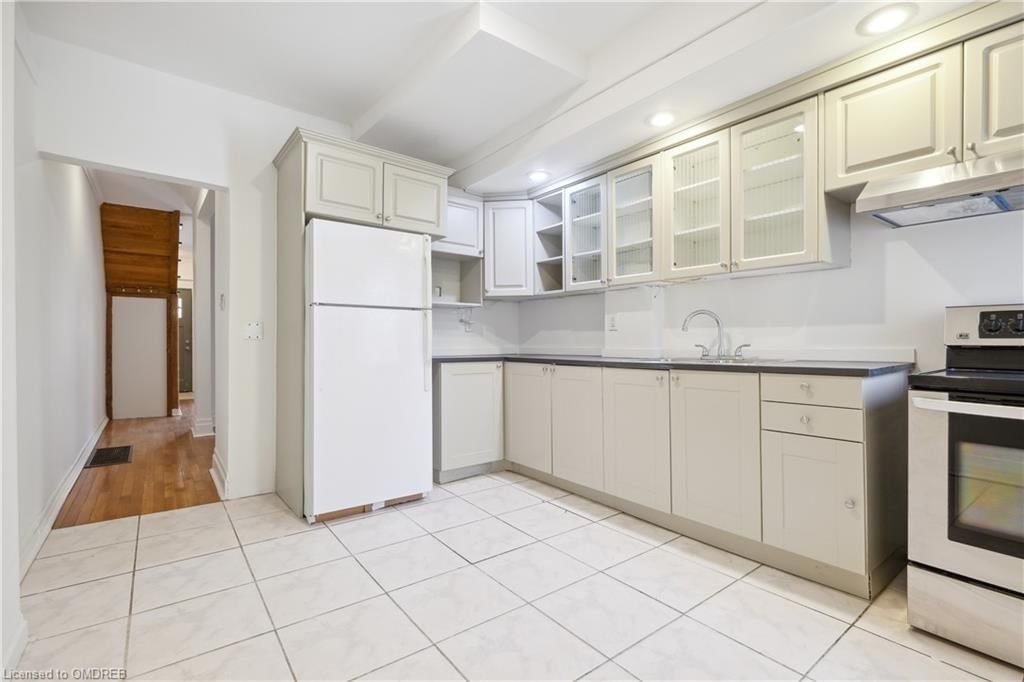
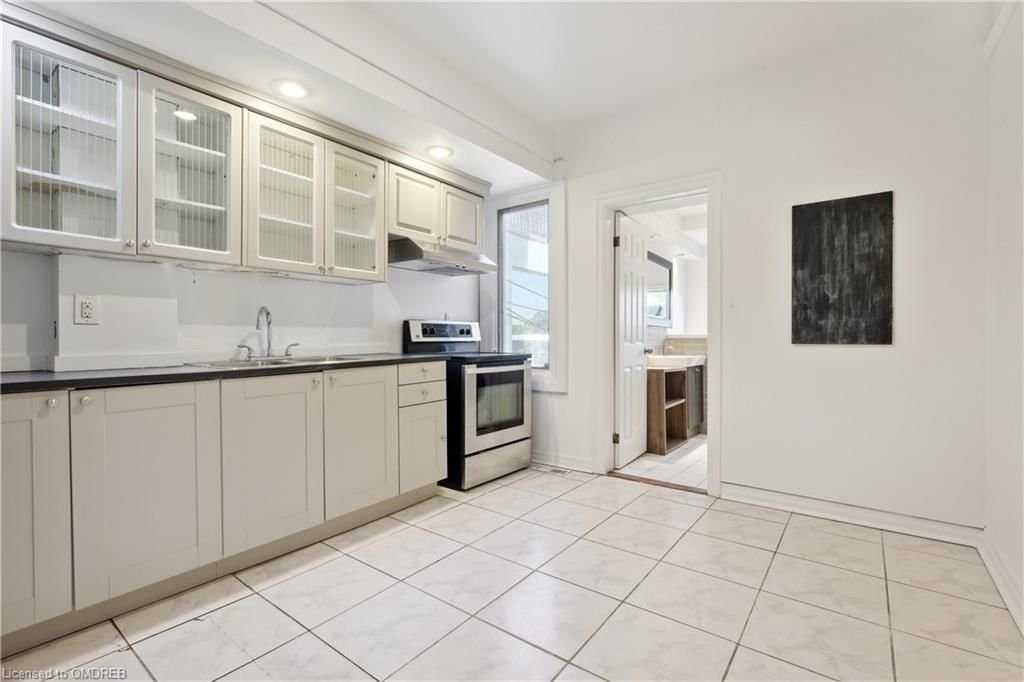
Kitchen
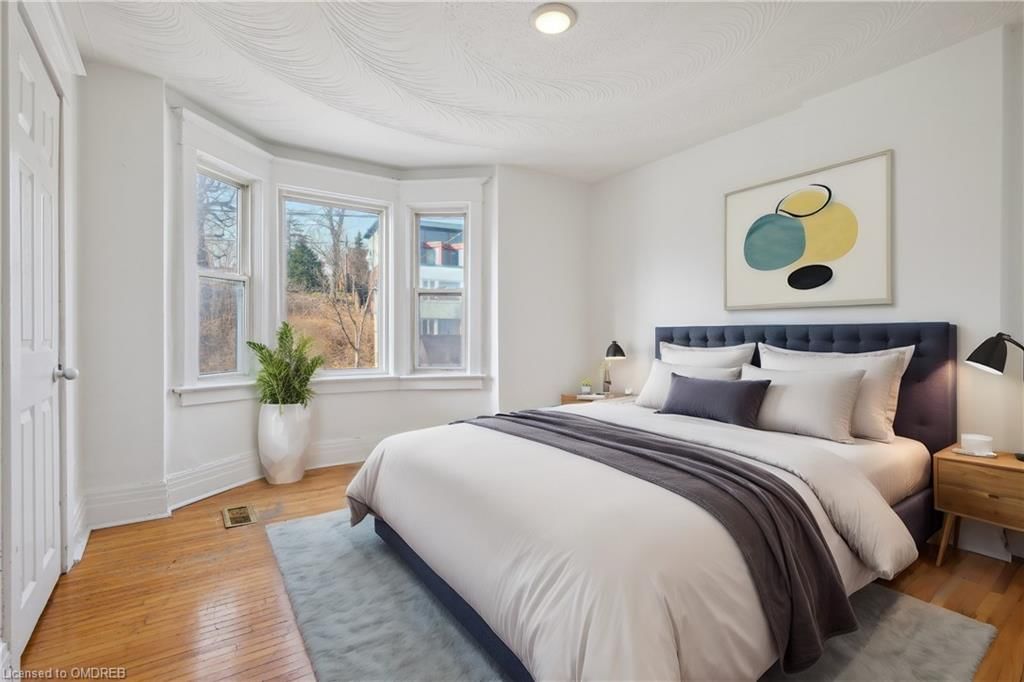
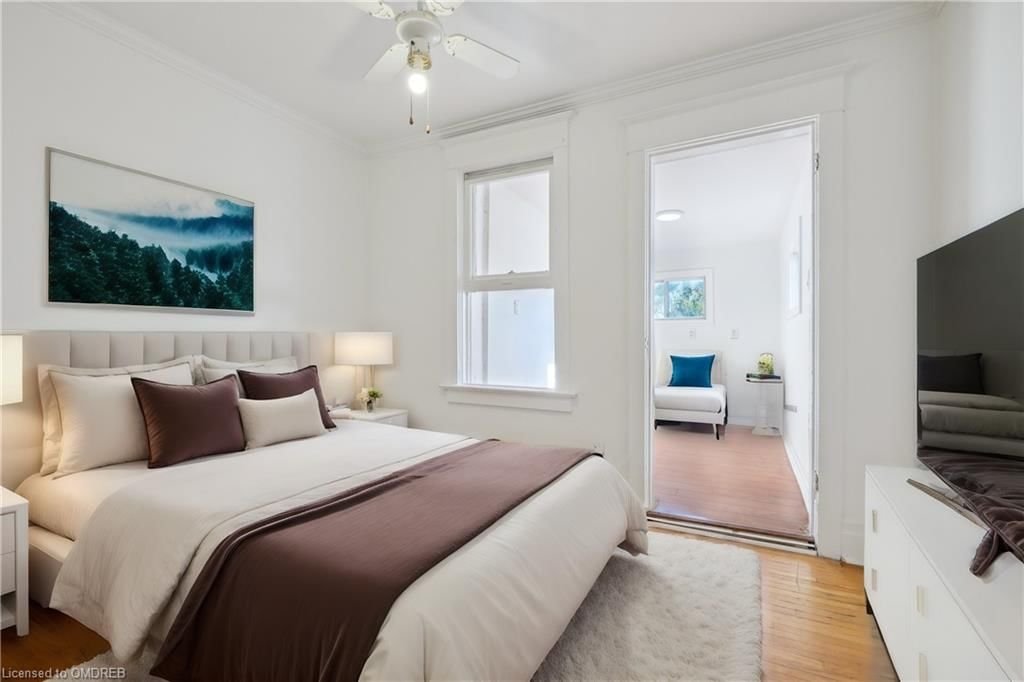
Bedroom Primary
Bedroom
Bedroom
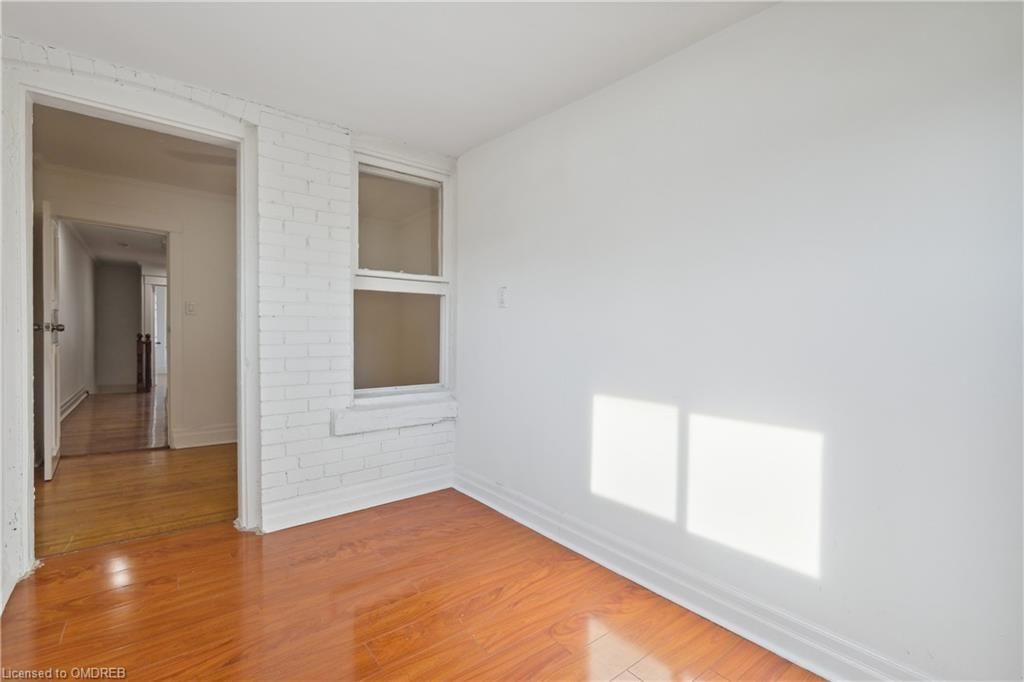
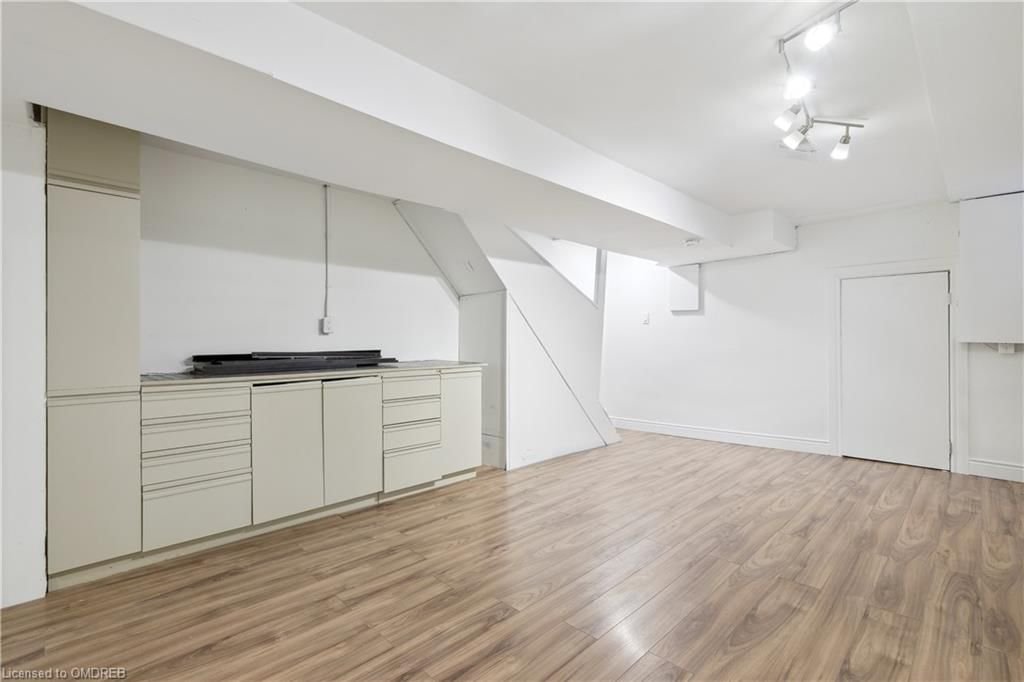
Recreation Room
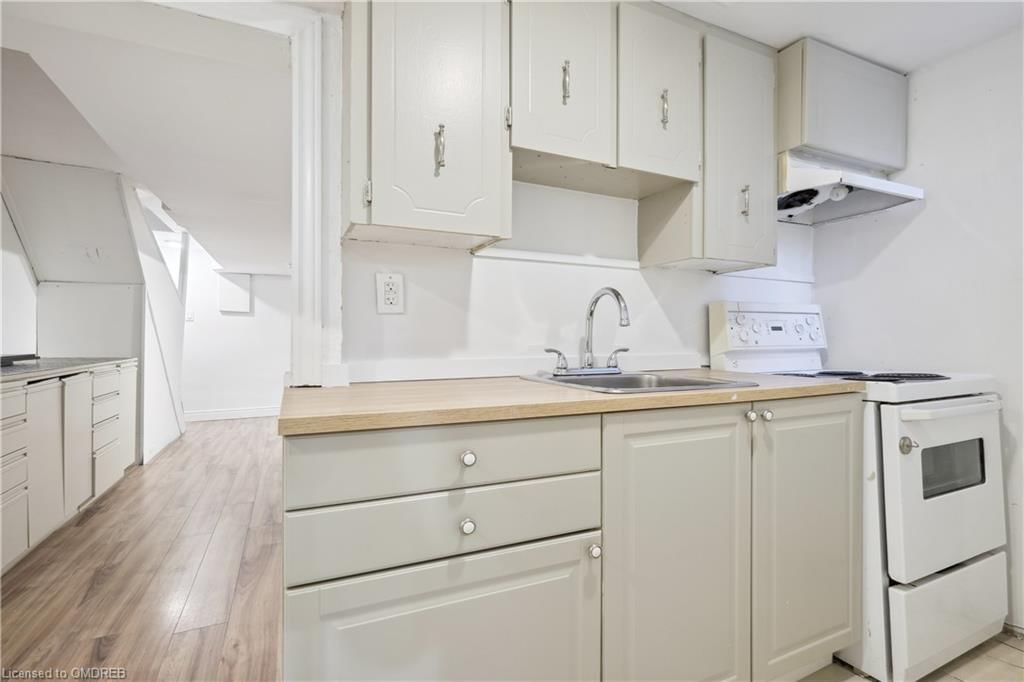
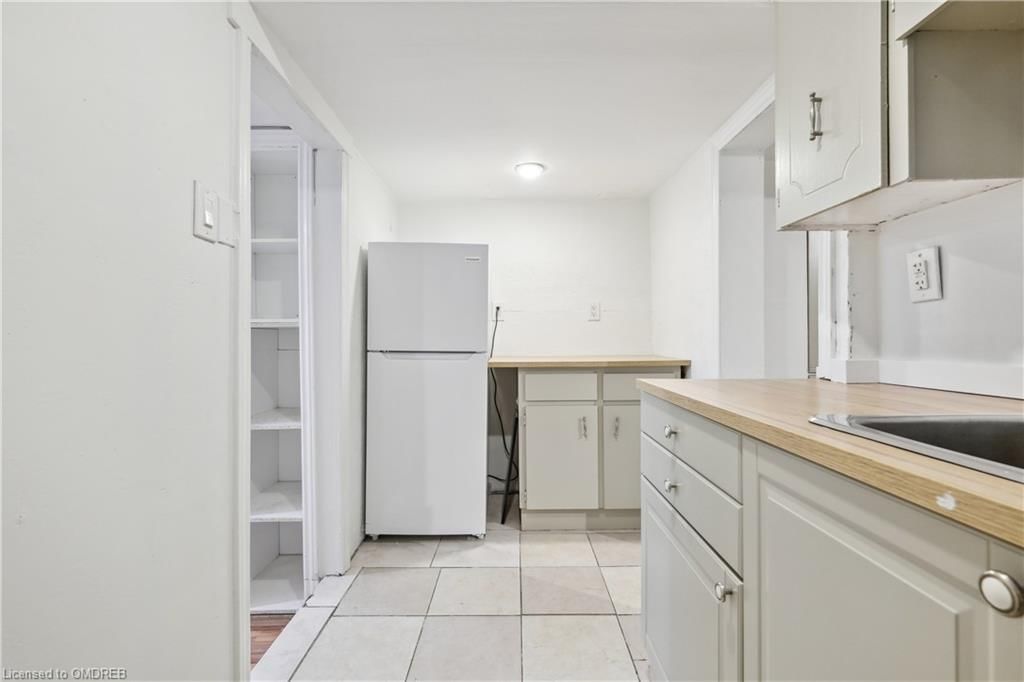
Kitchen
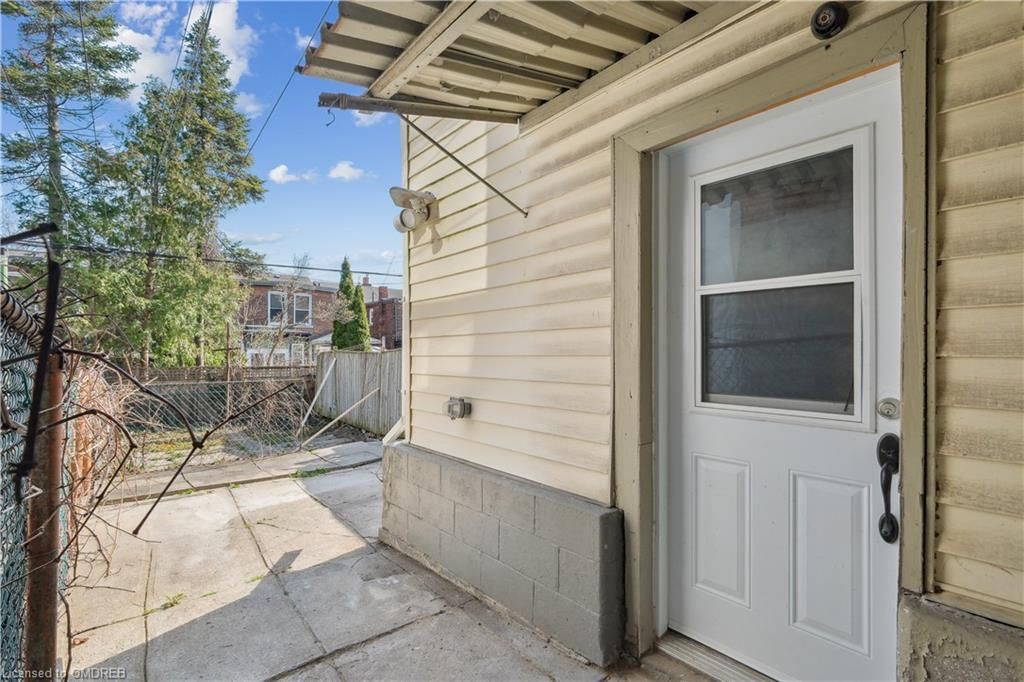
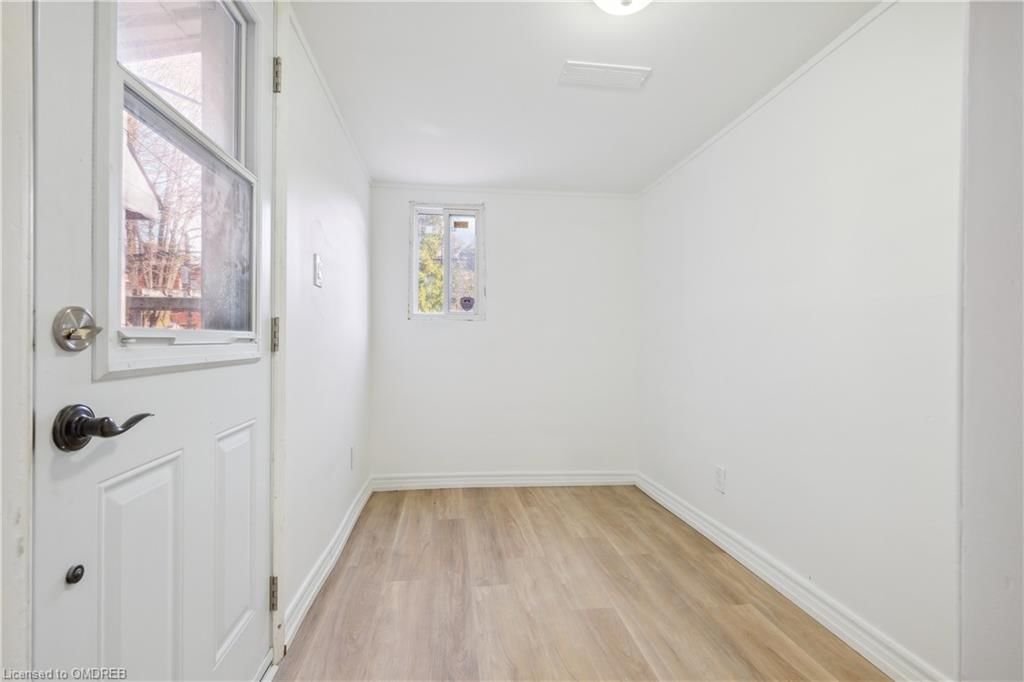
Mud Room
The graph below compares the average list price and average sale price of homes in this neighborhood by month for the last 24 months. When average sale price is greater than average list price, this may suggest a buyer's market. When average sale price is lower than the average list price this may suggest a seller's market.
The graph below illustrates the average days on market for homes in this neighborhood. The yellow area may indicate a buyer's market, the green area may indicate a balanced market and the red area may indicate a seller's market.
Sales Representative, Century 21 People’s Choice Realty Inc., Brokerage
(647) 576 - 2100
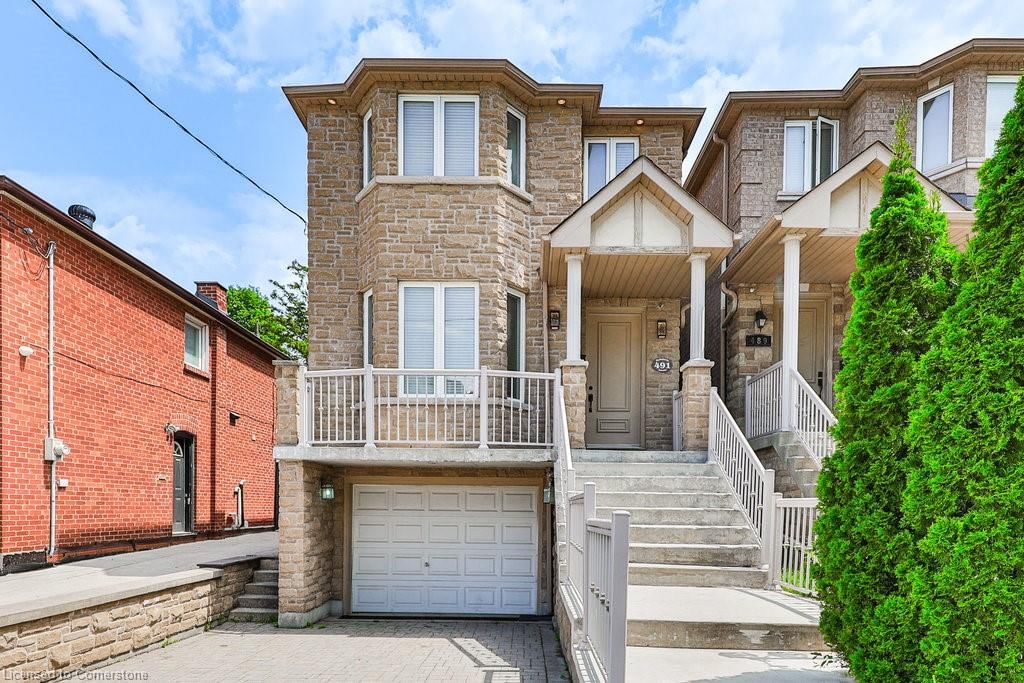
Toronto, Willowridge-Martingrove-Richview, M9R 3W6
Toronto, Humberlea-Pelmo Park W5, M9M 0C7
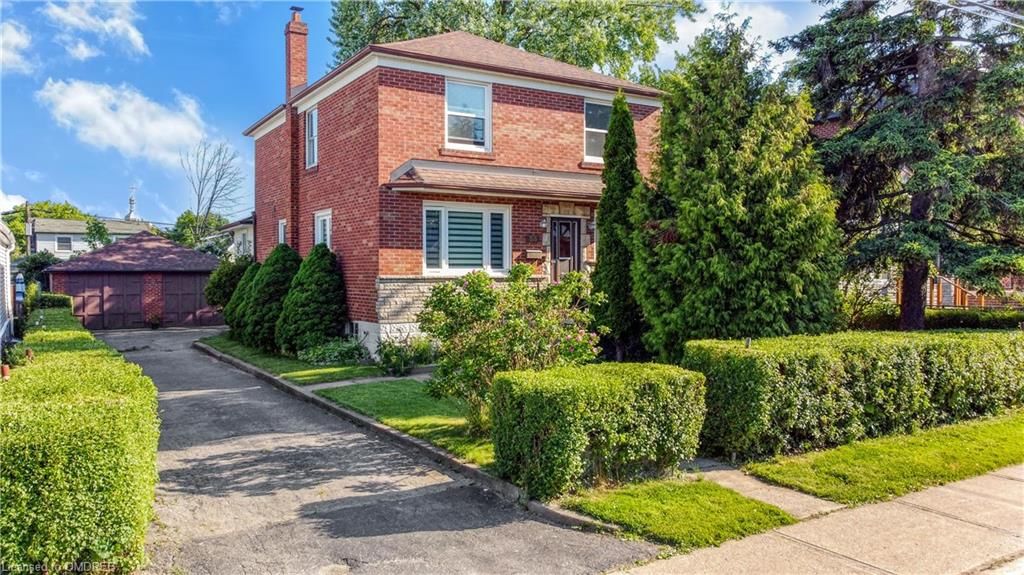
Toronto, Dovercourt-Wallace Emerson-Junction, M6H 3G8
Toronto, Islington-City Centre West, M9B 1H3